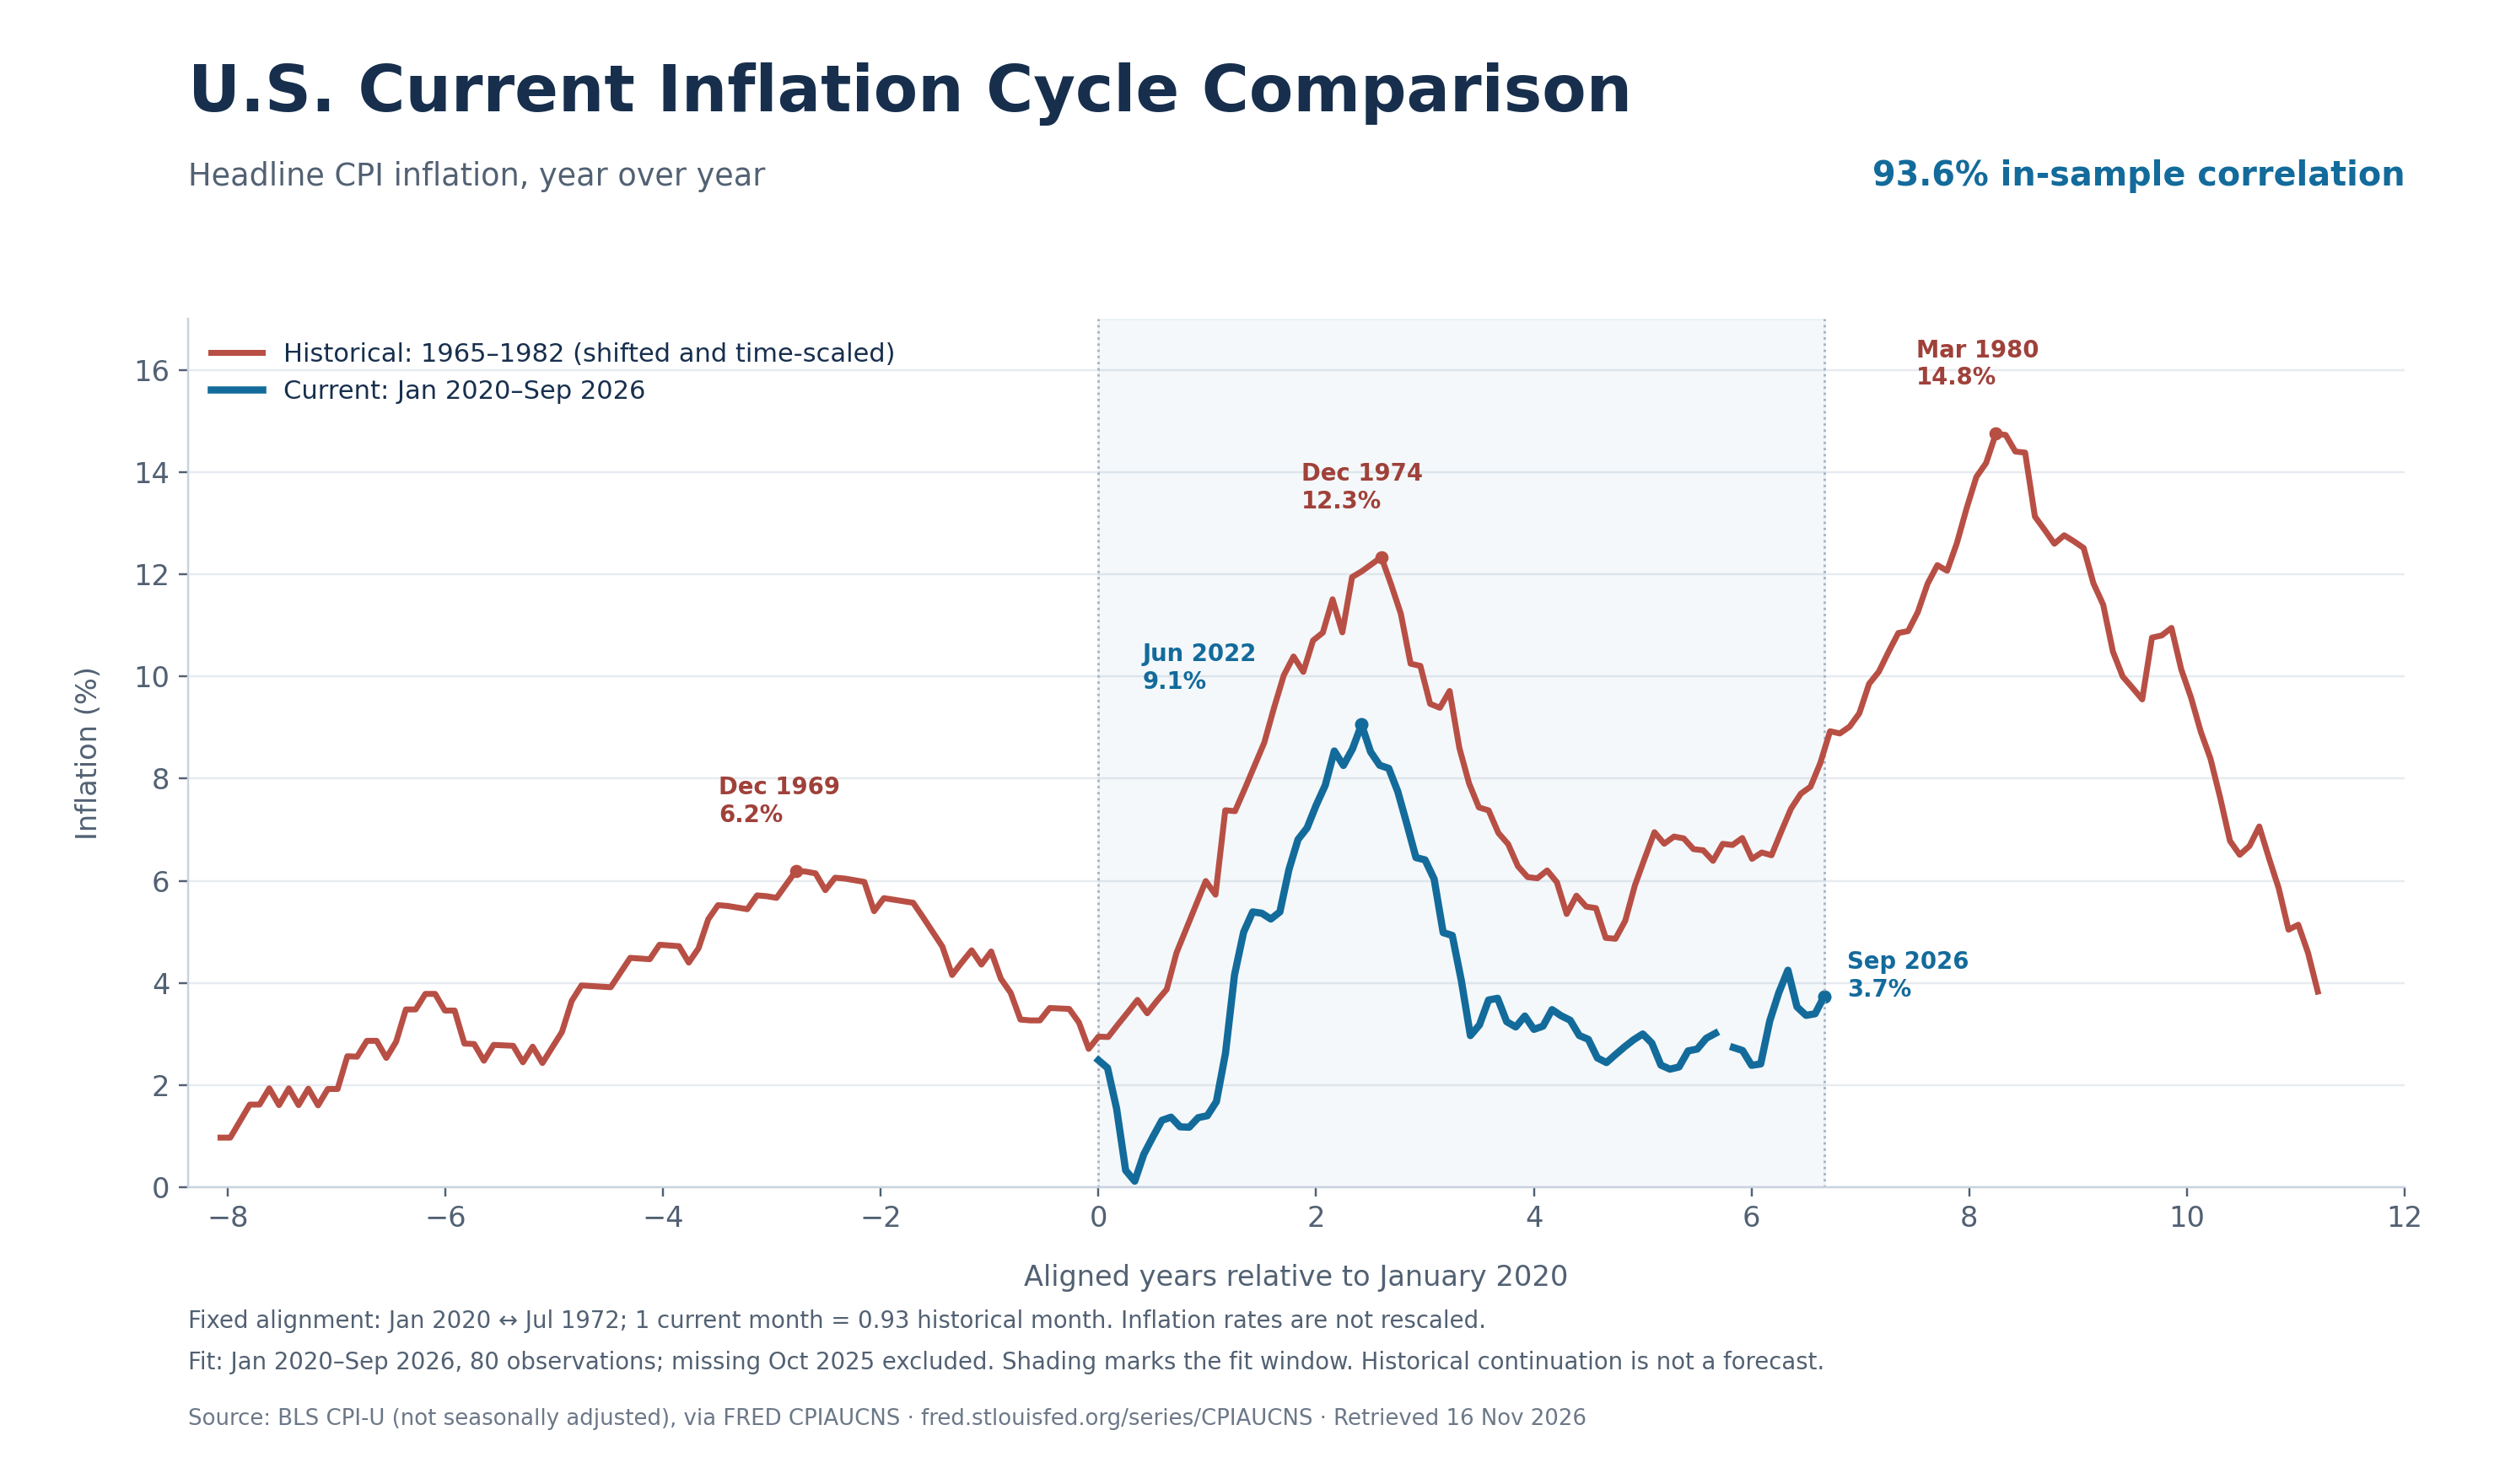
Inflation often develops in successive waves. This chart compares the current U.S. inflation cycle with the full Great Inflation of 1965–1982, keeping the 1969, 1974 and 1980 peaks together.
The best-fitting alignment produces a 93.6% correlation across 80 available monthly observations from January 2020 through September 2026. January 2020 aligns with July 1972, with each current month corresponding to 0.93 historical months. The 2022 peak therefore aligns most closely with the 1974 wave.
Inflation rates have not been shifted or rescaled. Historical inflation averaged 3.42 percentage points higher during the fitted period. The correlation describes similarity in the paths, rather than equality of inflation levels.
This alignment was selected to maximize the fit to the observed data. I will hold it fixed as new CPI readings arrive and track whether the relationship persists. The historical continuation shows what occurred then.
Data and methodology
Source: BLS CPI-U, not seasonally adjusted, via FRED. Year-over-year inflation; unavailable October 2025 and October 2026 readings are not interpolated.